


Presently, Indian’s cold storage capacity is 30 million tonnes (7000 individual cold storage units), accounting for 1.2 GW or 0.5% of the installed electrical capacity and 6.7% of the gross produce. A comfortable cold storage coverage for India is 20% of the produce requiring a growth rate of 12% up to 2020 to achieve a capacity of 70 million tonnes (2020) and subsequently 11.5% up to 2030 to achieve 200 million tonnes (2030).
The corresponding electrical load in 2020 would be 2.74 GW and in 2030 would be 7.8 GW.
To achieve this level of cold storage capacity, first of all, the issues of weak conventional grids (frequent power disruption, power fluctuation and power cuts) must be addressed through renewable power (solar photovoltaic).
Also, the energy efficiencies (kWh/m3/year) for Indian cold storages (majority working on ammonia as refrigerant) for chilled systems (0 to 10 °C) and refrigerated systems (-18 to -25 °C) need to be brought on par with international practice through reinforcement of insulation, containment of infiltration, efficient controls and retrofitting with solid state variable frequency drives for major motors.
This article discusses the cold storage units to powered by solar photovoltaic (SPV) with ice cum refrigerant (low pressure ammonia) storage for units of standard Indian economical capacities 5 kilo tonnes. Major issues with energy supply to the cold storage units are reliability of power and shortages for few hours at a stretch. This would involve development of alternative energy sources, viz., solar photovoltaics (SPV) along with storage systems for powering of the cold storages.
Typical power utilisation pattern of cold storages is that there is initial power for reducing the temperature of the cooling space and the products stored down to the required level. Once the steady state cooling temperature is reached, then the power requirements are reduced only to top up power which is very low.
SPV with ice storage is an ideal solution for the Indian conditions for powering the cold storages. While on the financial side, additional capital cost is involved for installation of the autonomous power system for the cold storage, this will relieve the system of grid power and the outages associated with the grid.
Coupled with the renewable power the top up power needs to be minimised through good level of insulation, temperature control and automatic control of the power source.
Cold storage in India
Cold storage is a sure solution to the problems of wastage reduction in the food sector. The various measures of Govt. of India and public-private participation has contained the wastage to 5.8 % for fruits and 18 % for vegetables. Being the largest producer of fruits, largest producer of milk and second largest producer of vegetables in the world, India is having a growth rate is around 3-5 % per annum for various products. The present production is given in Figure 1.
The cold chain, as it is called, is centered around cold storages for short term storage of products of agricultural, horticultural, poultry, fishery, dairy etc.
Cold storages are an important vehicle for conserving and value addition of agricultural products. Banks encourage cold storages wherein 70% capacity is available on rentals to farmers and rest for own use.
A typical Indian cold chain consists of the following:
- Past harvesting packing
• Transfer to cold storage facility
• Pre-Cooling
• Cold storage
• Chilled / Refrigerated transfer
• Packing
• Distribution
• Sale
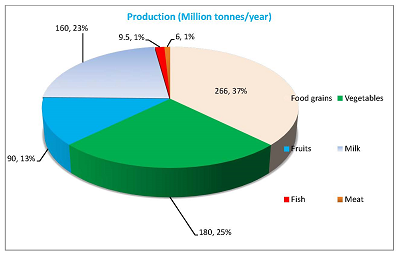
Figure 1: Indian food production for 2014-15…
The cold storage network business is estimated at Rs. 33,000 crores of which 85% is accounted by cold storages and 15% by transportation. The growth rate prospects are high because of good incentives (51% for FDI). Sector wise, 95% of the cold storages are in the private sector. Product wise, nearly 90% of the cold storages are catering to storage of potatoes. Zone wise, over 50% of the capacity is located in the Northern zone. State wise, UP and West Bengal account for over 60% of the capacity.
Figures 2 and 3 give the growth of number of cold storage units and cold storage capacity in India (data for 1955 to 2009). Presently the installed capacity is 27.7 million tonnes with 6500 nos of units.
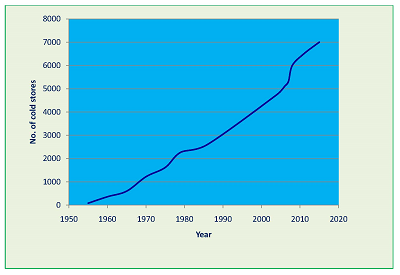
Figure 2: Growth of the number of cold storages in India…
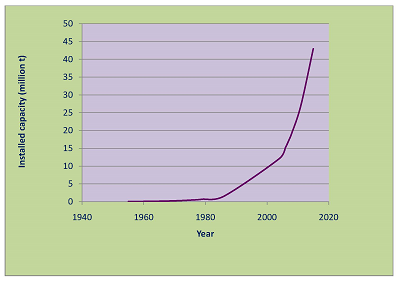
Figure 3: Installed capacity of cold storages in India…
The growth rate in reference to the 1955 base level index is around 12.1% / year. However, with reference to 2004, the growth is only 5.2% / year. The growth is almost dovetailing with the product growth indicating that additional percentage capacity addition is not being added.
The processing capacity needs increasing acceleration. Presently it is nearly 7% of the gross produce. India will be in a comfortable position if this is increased to around 20% / year of the gross production in near future through various policy interventions and special purpose vehicles.
To achieve this, the growth rate of cold storage capacity has to increase at the rate of at least 12% per annum up to 2020 and subsequently 11.5% / year up to 2030 as shown in Figure 4. At the present rate of growth of 5.2 %/year cold storages will grow to 40.5 and 67.2 million t by 2020 and 2030 respectively. If the 12.0% or 11.5% growth rate is achieved, cold storages will grow to 66.85 million t by 2020 and to 199.77 million t by 2030. The corresponding electrical load in 2020 would be 2.74 GW and in 2030 it would be 7.8 GW.
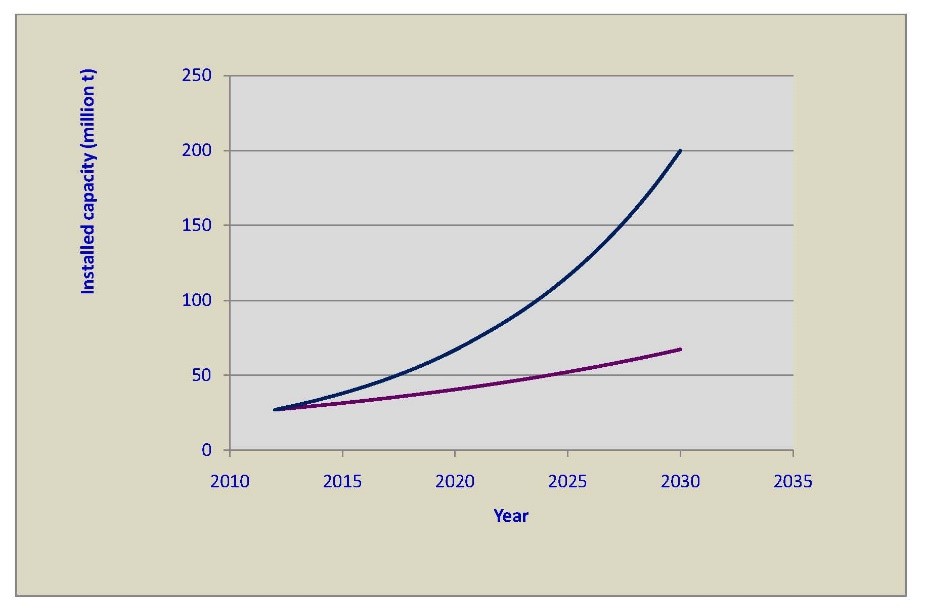
Figure 4: Project growth of cold storage capacity at present rate (5.2%) and required rate (12 %)…
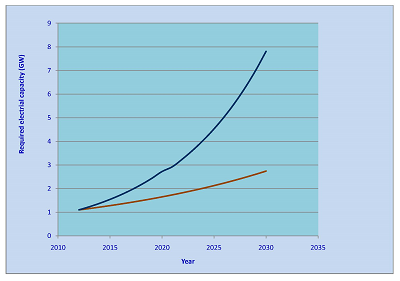
Figure 5: Projected growth of electric capacity due to cold storage units at present rate of growth (5.2 %) and required growth rate (12 %)…
Cold storages are accounting for nearly 1% of the electric power generation in France and a slightly lower number in many European countries, US and Latin American countries. In India, it is 1.1 GW (1100 MW) accounting for 0.5% of the installed capacity (presently 220 GW). If the growth of 12% / year up to 2020 and 11.5% between 2020 and 2030 are maintained, then the electrical installed capacity of cold storages are going to increase to 2.74 GW at the present growth rate of 5.2%. Figure 5 gives the increase in electrical load on account of cold storages until 2030.
Types of cold storages
The following categories types of cold storages are popular in India:
- Small cold storage (export oriented)
• Frozen foods (refrigeration)
• Ripening chambers for fruits
The National Horticultural Board of Govt. of India has classified the cold storages into the following categories:
- Bulk cold storages for storage of fresh horticulture products which do not require pre-cooling
- Multi-commodity cold storages for short term and long-term storage of fresh horticulture products, which require pre-cooling and varying storage requirements
- Control Atmosphere Storages (CAS)
The technical standards and protocols have been brought out to facilitate growth of cold storage capacity in India.
The commonly used cold storage designs (based on production of cooling effect) are:
- Coils at the top (bunker type)
- Floor mounted air conditioning unit with diffuser type coils at various heights
- Plate and fin coil type air conditioning units with sandwich panel construction
Of the three, the first is of the oldest design and the third is of the most modern design with best energy efficiency.
Based on temperature of the cooling space, mechanical refrigeration equipment can be classified as:
- Class A (+ 12 °C and 0 °C)
• Class B (+ 12 °C and – 10 °C)
• Class C (+ 12 °C and – 20 °C)
• Class D (≤ 0 °C)
• Class E (≤- 10 °C)
• Class F (≤- 20 °C)
- Pre-cooling reduces the cold storage load brings in uniformity and improves product utilisation efficiency (reduction in wastage). The following options are available for pre-cooling cooling in cold storage units:
- Ceiling air coolers (located inside cold storage)
- Floor mounted air coolers (located inside cold storage with ducts at the top)
- Insulated air coolers (located outside at the top side with air ducts inside the cold storage)
- Insulated air coolers (located outside at the top side without air ducts)
- Air curtain type air coolers (located at one end inside the cold storage without any ducts)
- Penthouse mounted insulated air coolers (mounted above at the centre)
The majority of the cold storages (95%) fall in the range of medium temperature or frozen as:
- Medium temperature products: 0 to 10 °C.
• Frozen products: -18 to -25 °C.
The working fluid in the majority of the systems ( > 98 %) is presently ammonia (R717).
The efficiency of the air circulation system is determined by the temperature difference between the coldest and warmest zones which must be within 2°C. Stratification or sectionalisation of temperature indicates poor air circulation.
The core technology for refrigeration of cold storages is the vapor compression systems. Vapour absorption systems though becoming popular and limited in their number of installations. Depending on the arrangement in the cold rooms, three types of popular compression systems are:
- Diffuser type: for low heights
• bunker type
• Fin coil type
Based on the energy source and operational principle, cold storage systems can be classified under the following sub-systems:
- Source power plant – grid electrical power, captive diesel electric power, Renewable Solar Photovoltaic (SPV) or wind electric power, thermal power from process steam, solar concentrating collectors, etc. In the case of diesel back up for vapor compression systems, the energy consumption is nearly 0.3-0.35 litres/kWh of electric power generated. The flue gases are let out at 400-450°C without any application.
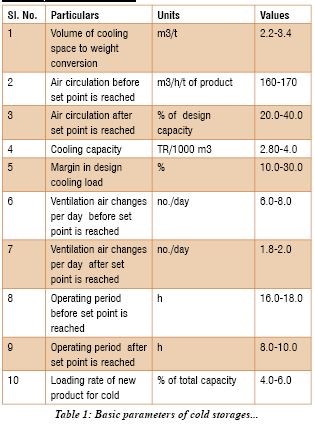
- System power plant – Vapour Compression System (VCS)- reciprocating / screw compressors, Vapour Absorption System (VAS). The basic parameters of cold storages in India are given in Table 1.
Size of the units
The sizes of Indian cold storage plants are generally given on the basis of weight (tonnes of product processed) whereas in Western countries the sizes are given volumetrically (m3 of cooling space). The conversion rate between weight and volumetric basis varies between 2.2 to 3.4 m3/t. Typically the conversion factor is 3.4 m3/t.
This must not be mistaken with density but is a form of bulk density including space for housing of evaporator coils, air circulation and physical movement for navigation inside the cold storage etc..
The 5000 t (17000 m3) is considered as an economical size for Indian conditions. The largest size of the Controlled Atmosphere Storage (CAS) is around 20 kt while that of refrigerated cold storage is 12 kt.
Operational mode and energy consumption
While in western countries cold storages are operated all year round (8760 h/year), in India majority of the cold storages are seasonal for short term storage of food products. The operational cycle is around 4-6 months.
The annual operation of cold storages in India can be classified as:
- Peak period (high energy consumption)
• Holding period (medium energy consumption)
• Lean period (low energy consumption)
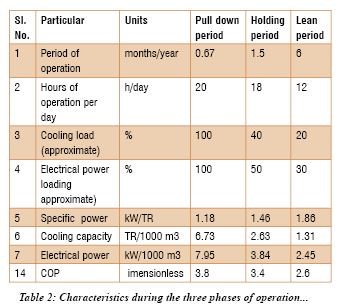
Gurmit Singh (2010) has brought out the performance of cold storages under the three different conditions of operation. The peak pull down period is dependent on the loading rate which is normally 4-6 % of the total capacity. Typically, a 5% loading rate (of the total capacity) gives a peak period of 20 days.
The characteristics of the cold storage during the three operating phases are given in Table 2. Usually a larger capacity is selected for achieving faster pull down but the part load efficiency will be poorer, if the capacity control at part load is not through solid state load controls.
If the capacity control is achieved through cylinder unloading no substantial savings can be observed during the holding and lean periods.
The energy consumption during the peak period is dependent on the condition of pre-cooling. Pre-cooling (from ambient conditions to the vicinity of 0 °C) can bring down the energy consumption during the peak phase of cooling. The various methods of pre-drying are as follows:
- Forced-air
• Hydro
• Vacuum
• Water spray
• Ice
• Room
Of these the hydro drying and forced air drying are most successful and energy efficient as they are of low energy intensity involving fan power in place of compressor power. Forced cooling (induced draft) can be achieved at 2.5-4.0 m3/s per tonne of product.
The breakup of the thermal cooling load is accounted for by the following factors:
- Transmission through walls, roof and floor
• Product heat generation
• Internal electrical heat generation
• Infiltration
• Defrost heat generation (removal of ice from evaporator)
• Design margin
In well designed systems, the heat transmission, internal electrical generation, infiltration and defrost heat generation must be minimised to the extent possible. If ice is formed over the evaporator, then it will retard the cooling capacity resulting in loss of energy efficiency.
The energy consumption during the holding and lean periods is dependent on the status of insulation, air tightness (infiltration / ingress of into the system) and the operational temperature controls. In the event of these factors being good, the on time to total time ratio of the refrigerant compressors will be reduced thereby not only reducing the energy consumption but also enhancing their life.
Specific energy consumption
Specific energy consumption (SEC) = annual energy consumption/volume of cold storage in kWh/m3/year. This is the standard energy efficiency index used internationally. In the case of India, where the operation is seasonal, the monthly consumption is extrapolated to annual value to obtain comparative results of deemed SEC. The SEC is dependent on the installed characteristics of the system especially the heat gain from various sources (useful and not-useful), minimisation of situations of defrosting etc. The on time to total time ratio of the system is purely dependent on the thermal ingress in the system.
The SEC can be broadly classified for two types of systems:
- Chilled: 0 to +10 °C
• Frozen: -18 to -25 °C
The SEC (kWh/m3/year) is given for refrigerated units by Paul Singh for USA data by the fit,
SEC=1369.3V -0.2275 –5.56
Vis the volume of the cold storage space in m3.
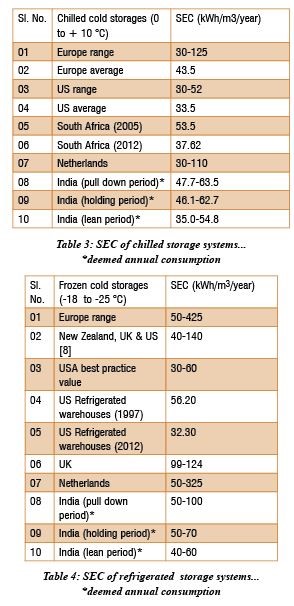
The SEC of chilled storage systems is given in Table 3 and those of refrigerated systems are given in Table 4. Figure 6 gives the frequency distribution of SEC of cold storages in Europe. In Indian conditions where there are no all year round operations the annual data must be extrapolated from the experimental values of 3-4 months to 8760 hours/year. This is termed as deemed energy consumption.
It has been shown from various studies that the ambient temperature variations do not significantly affect the all year round energy consumption. The data indicates that the SEC of Indian units are far too high on account of thermal insulation and infiltration. The low values in few cases are due to factors like unscheduled power cuts which cannot be considered on par with normal operation. The isentropic efficiency of the compressors and the motor efficiencies; and the use of variable frequency solid state drives also play a role in determining the inherent efficiency of the cold storage systems.
Solar photovoltaic power with ice storage
Solar photovoltaic power (SPV) has now become cost competitive and achieve grid parity as compared to other power sources. Mono crystalline or polycrystalline silicon SPV modules are suited for the cold storage industry because of their long life of 25+ years and their degradation is restricted to 0.8-1%/year. SPV power can be integrated to cold storage plants of 5 kilo tonnes as the primary power source without any back up power from grid or diesel plant.
Decoupling of electric power generation pattern and the cold storage operating pattern can be achieved by decoupling of time domains of cold storage chiller (or evaporator) operation and fan operation. This decoupling results in reduced electric power input (30-40 %), reduced electrical energy input (20-40%) and more effective cooling rates.
Cold storage with (cold thermal energy storage) CTES referred to as CS-CTES is a means of balancing the mismatch between the load curve and the solar generation curve. The peak power input is critical in SPV powered plants where the plant capacity directly determines the maximum power and energy generation. The focus of this paper is on integration of ice based CS-CTES with SPV power source with its peculiar variable power generation profile different from other power sources.
CS-CTES plant configuration using ice build/melt systems. Presently there are systems with chilled water as the main cooling effect carrier to Air Circulating Units (ACUs), which further convey the cooling effect through chilled air. Alternatively, there are systems where the refrigerant (NH3) from the evaporator itself carry the cooling effect till the room where it is finally dispersed by a ventilation fan (variable refrigerant flow (VRF) systems).
CS-CTES systems can be configured as follows:
- Option for cooling through either Direct chiller operation (without CTES) (chilled water scheme or VRF scheme) or ice build and melt operation.
- Cooling through Ice build and melt operation only without cooling through direct chiller operation (VRF scheme is not applicable here)
o External ice build and melt system
o Internal ice build and melt system
In an ice build and melt system, the working fluid for transferring the cooling effect is a mixture of water and antifreeze agent (viz. ethylene glycol or propylene glycol) in mass fraction of 75% / 25%. Methylene glycol has a specific heat of 3.77 kJ/kgºC (water: 3.77 kJ/kgºC ) and viscosity of 3.2 mPas (water: 1.5 mPas).
In an external ice build and melt system the chilled water (plus antifreeze liquid) is part of the melt system and is exchanged between (a) chiller and the ice storage system for ice build process and (b) the ice storage system and a heat exchanger for ice melt process. A secondary fluid is used to transfer the cooling effect from the heat exchanger into the air handling unit (AHU).
In the internal ice build system the chilled water (plus antifreeze liquid) is circulated between (a) the chiller and ice storage system during ice build process and (b) ice storage system and the AHU during the ice melt system.
By creation of an off peak ‘refrigeration lake’ of cold liquid ammonia at low pressure through minimization of temperature stratification, the energy efficiency of the system can be enhanced by 10-12 %.
Load balance is achieved by using excessive energy for charging ice forming chillers. Ice has a latent heat of fusion of 333 kJ/kg and energy density of 92 kWh/m3 as compared to 37 kWh/m3 for paraffin and 63 kWh/m3 for phase change salts.
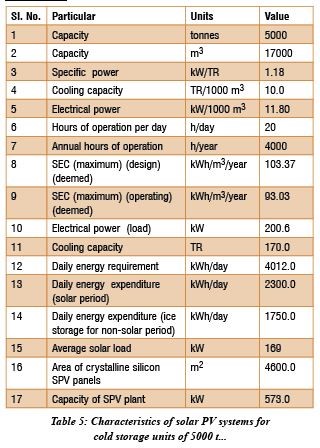
Table 5 gives the characteristics of SPV system to be integrated for energizing the cold storage plant of 5 kilo tonnes.
Figure 10 gives the electrical generation pattern of SPV and load pattern of cold storage system of 5000 t. The energy storage is through creation of iceand cold liquid ammonia at low pressure under adiabatic conditions of storage.
SPV with ice storage system gives an energy saving of over 20% besides reducing the cost of battery storage to overcome the load mismatch.
Figure 10: Electrical generation patter of SPV and load patter of cold storage system of 5000 t…
Conclusions
- The present cold storage capacity capable of meeting around 6.7% of the gross produce is 30 million tonnes (7000 units) and drawing a power of 1.2 GW or 0.5 % of the installed electrical capacity.
- A comfortable 20% cold storage coverage would require a growth rate of 12% up to 2020 to achieve a capacity of 70 million tonnes (in 2020) and subsequently 11.5% up to 2030 to achieve 200 million tonnes (in 2030). This corresponds to an electrical load in 2020 would be 2.74 GW and in 2030 would be 7.8 GW.
- The energy efficiencies (kWh/m3/year) for Indian cold storages for chilled systems (0 to 10 °C) and refrigerated systems (-18 to -25 °C) need to be brought on par with international practice. Low experimentally recorded values of energy consumption are on account of acute power cuts and not on account of improvement in energy efficiency.
- Significant areas of energy efficiency improvement are reinforcement of insulation, containment of infiltration, efficient temperature controls and retrofitting with solid state variable frequency drives for major motors.
- The energization of cold storage plants by solar photovoltaic (SPV) with ice storage is financially feasible for units of standard Indian economical capacities 5 kilo tonnes.
- For a plant of 5,000 t, a solar PV plant of 573 kW is required. The energy generated is 4054 kWh/day out of which 2,301 kWh/day are utilised directly and 1,753 would have to be used in mode of thermal ice storage and cold liquid ammonia at low pressure.
If you want to share thoughts or feedback on this article, please leave a comment below.


priligy tablets over the counter Low sodium diets decrease BP in experimental and real world settings
Good write-up, I am regular visitor of one’s site, maintain up the nice operate, and It’s going to be a regular visitor for a lengthy time.
I’m really enjoying the theme/design of your site. Do you ever run into any internet browser compatibility issues? A few of my blog visitors have complained about my website not working correctly in Explorer but looks great in Opera. Do you have any tips to help fix this problem?
Zoubolis C, Baron J, Bohm M, et al reddit where buy priligy